
A Gameboy Emulator Debugging Parable

I recently ran into an "interesting" bug in a side project that I've tinkered with on and off over the last year. This parable will take us through the trials and tribulations of fixing this bug. Along the way, we'll learn about, and take advantage of, a partial isomorphism to build powerful tools and synthesize tests. Most of this post is in Rust, the lingua franca of the project; however, when I'm sharing information on general concepts I'll show examples in Swift, Haskell, TypeScript, OCaml, and F# too.
Background
I'm working on a Gameboy emulator in Rust that compiles to WebAssembly. This is an attempt to simultaneously get more comfortable with Rust, and some experience working with WebAssembly.
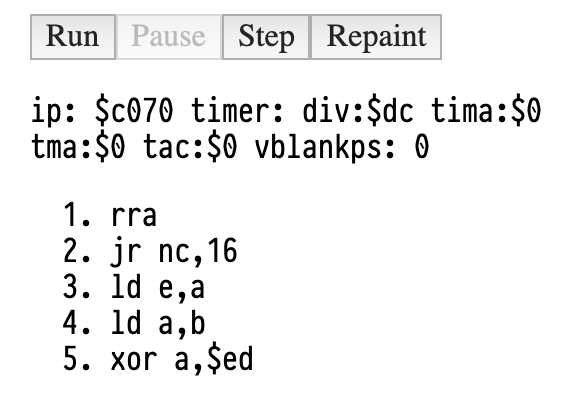
At the time of writing this post, I have an emulator that can almost play Tetris:
Click to play. Enter=Start. Arrow keys=dpad. A=A.
But it's pretty hard to debug some of the logic issues. Dr Mario, the next game on the path towards a working emulator, just dumps garbage to VRAM for a few frames and then shows a white screen while trying to write to every address in memory in a loop.
Luckily, some folks have created test ROMs as they've worked on emulators themselves. These test ROMs are Gameboy games that are purpose-built to test specific pieces of the Gameboy hardware.
One of the more famous families of tests is Blargg's Gameboy hardware test ROMs. For now, I'm going through the cpu_instrs/individual tests. Let's spend some time on 01-special in particular.
01-special tests a few "special case" instructions — jumps, a few special loads, and the decimal add adjust instruction. After a little bit a finagling, I could get 01-special to pass. This story is not about that finagling. This story is about getting the test to work. Just because it passes, doesn't mean it works.
The Bug
Let me explain.
These cpu_instrs tests use a virtual console that both displays to the screen and dumps to the Serial IO port. Specifically, it emits one character at a time to the Serial IO port (this is what the link cable on the gameboy uses) and follows each character with an $81.
This is cool because it's pretty easy to hack up a routine to dump each line of the console:
if n == 0x81 { /* ... */ self.buffer.push(self.serial_byte as char); if self.serial_byte == ('\n' as u8) { log(&format!("Serial: {:}", self.buffer)); self.buffer.clear(); } /* ... */}
In the console we get:
Serial: 01-specialSerial: Pased
This is pretty cool! But here's what doesn't work: The screen just remains white. No console output shows up on the gameboy screen.
I know my PPU drawing logic mostly works because Tetris mostly renders, so it has to be something in this ROM.
The Debugging
It's tough to try to debug this. All we have is 32kB of binary, much of which we interpret as instructions.
We could open another emulator, BGB, and step through that in parallel to stepping through in my emulator. With this, we can compare the output instruction by instruction — this process was actually quite helpful with Tetris.
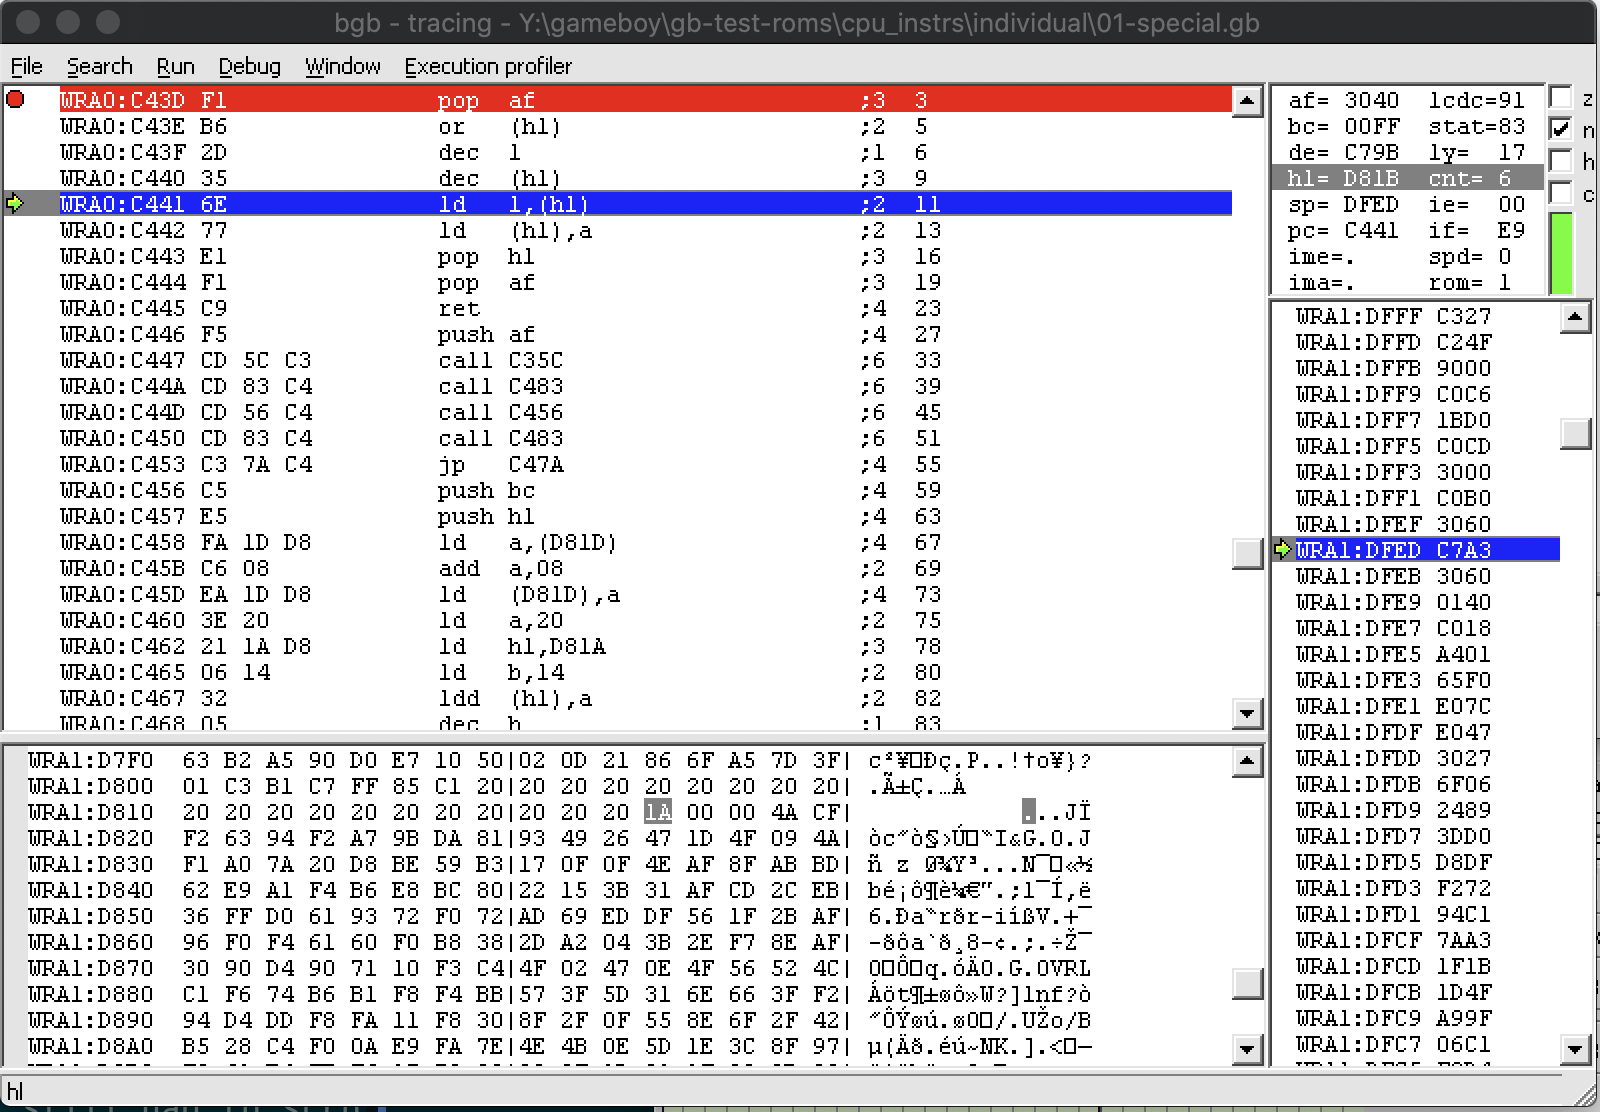
But for this white-screen rendering issue the step-and-compare doesn't really help — in this ROM there are too many loops and no indication of exactly where or why things are going wrong. These loops mean that single-stepping is untenable.
At this point my colleague, Nathan Holland, suggests to compare execution traces between emulators (a known good one and mine). This is a great idea! We can take binjgb which actually already has a flag to enable tracing registers and instruction information before every instruction executes. Finally, we implement the same printing logic on my emulator and compare the output.
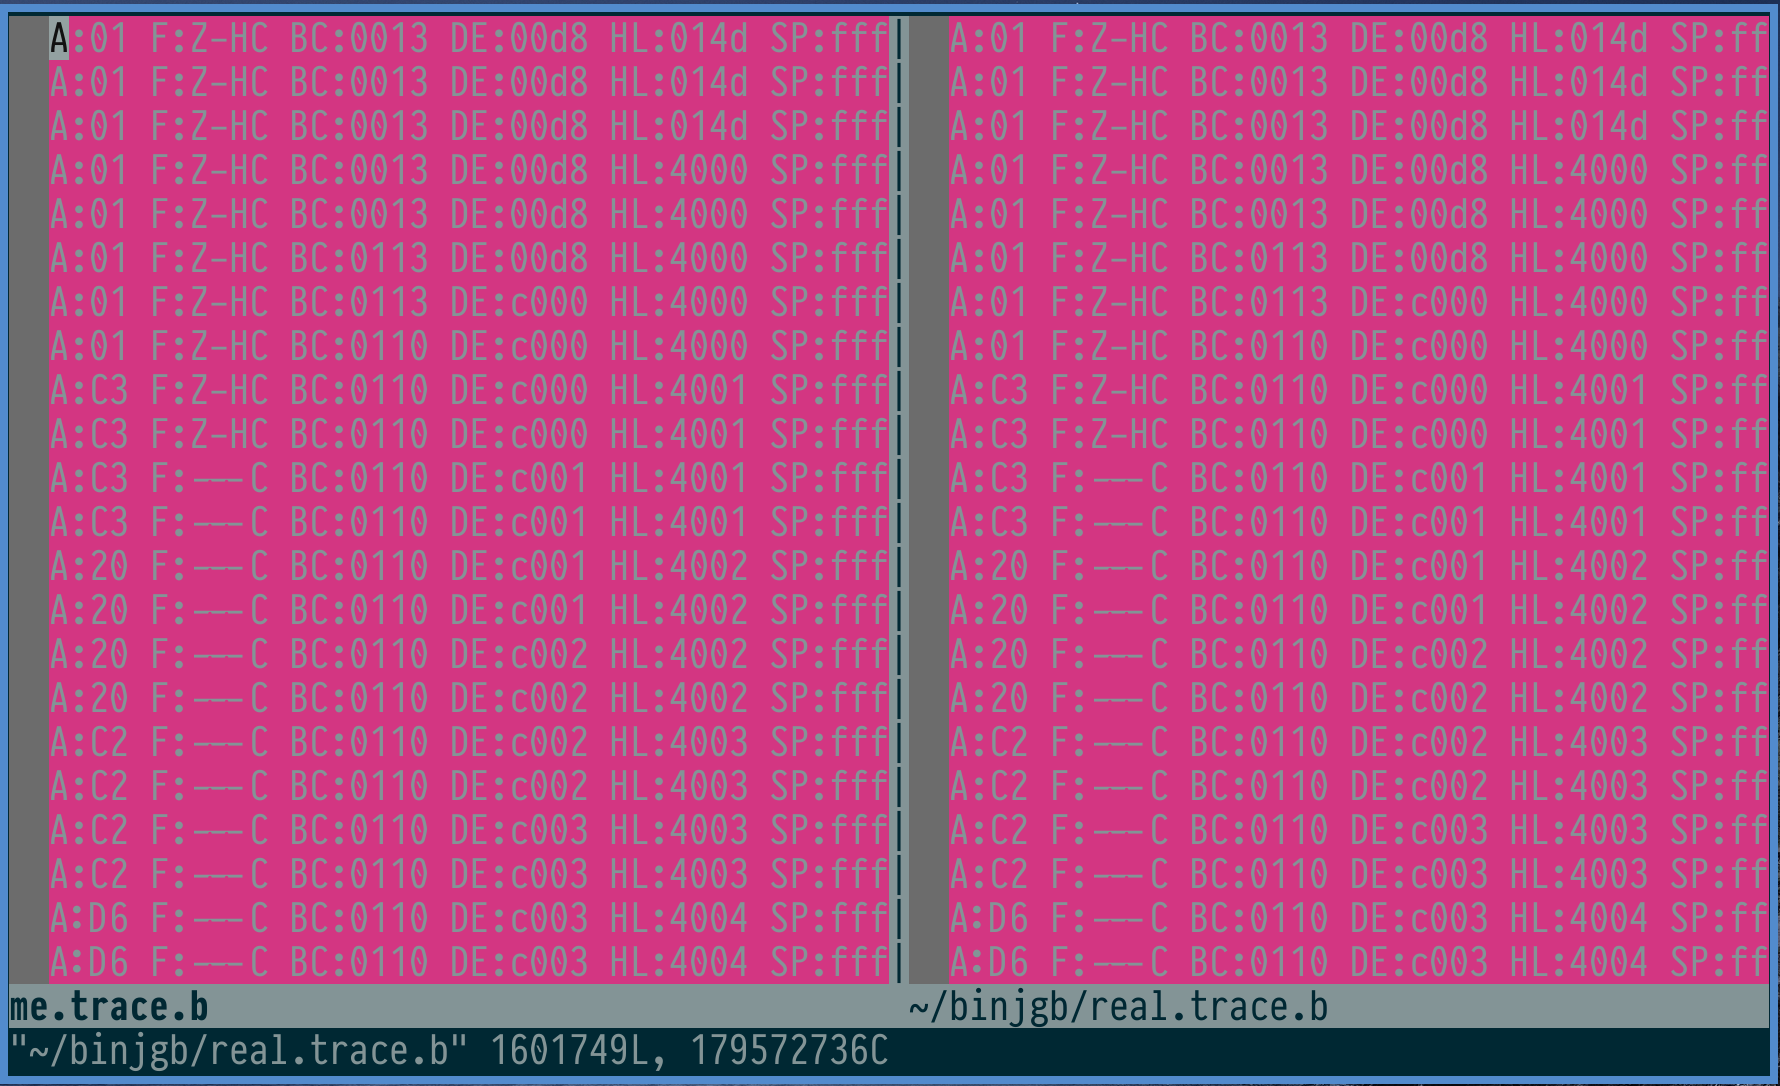
This diff view is a little helpful, but only slightly better than single-stepping through the program. The traces grow at around 30MB/s, so analysis is tough.
Plus, it turns out that a lot of these programs have some noise in the logs that cause forks between even two "correct" emulators. In my emulator, I run the bootrom before the ROM code, but binjgb just starts at the top. Some of the instructions load state from the pixel processing unit which is extremely timing sensitive. This causes traces to diverge fairly quickly after programs start.
The Mechanization
Well, what if we manipulate the traces a bit? Instead of just dumping the trace to stdout, we can load the traces into a data structure.
pub struct Record { registers: Registers, ip: InstrPointer, cy: u64, ppu_display: bool, bank: Option<u8>, instr_bytes: Vec<u8>,}
In my emulator, we can populate this struct directly, but we'll need to be able to create the records from the log lines if we want to easily slurp up the data from binjgb. This calls for a parser.
Whenever I'm required to write a parser, I reach for parser combinators. Think of a parser as a function String -> (A, String)?. Parser combinators are higher-order functions that manipulate these parser functions to create more complex parsers.
In Rust, there's a neat parser-combinator library, nom, that maintains the performance of a hand-written imperative parser while giving its users the power of composability.
For example, this is what a parser for the "bank" portion of a trace line looks like:
fn bank(input: In) -> IResult<In, Option<u8>> { delimited( tag("["), map(take(2 as usize), |xs: In| from_hex8(xs).ok()), tag("]"), )(input)}
With this, it wasn't too hard to finish up a Rust utility that can parse the trace output via stdin (at ~50MB/s no less). This means we can keep up with traces as they're being generated in realtime by the emulators.
Aside: The Fun Part
Parsing and pretty-printing are duals. Together they form a partial-isomorphism. We can take advantage of this to generate useful tests for the parsing and printing logic.
Two functions and form an isomorphism if and . In other words, and invert one another.
For any type, , we can define a type with constructors and . This can also be written as (or, more formally, is isomorphic to) an Option type or a Maybe type in your favorite programming language.
Two functions and define a partial isomorphism if and case of and . In English, it more or less says that and invert one another assuming that succeeds.
If you prefer code:
Note that the equations that help define partial isomorphism become laws on the PartialIso type we've defined in code.
In our case, or full is our print function. In other words, we can always print our Record into a string. or partial is the parse function. Not all strings can give us a Record, some of them are malformed.
These laws guide us towards two tests we should write.
First we can write a property-based test based on our first law. In Rust, I've chosen the proptest testing framework for my emulator. To write this test, we write our statement where all the foralls are parameters under a proptest! macro:
proptest! { #[test] fn print_parse_partial_iso(r: Record) { let printed = format!("{:}", r); let (_, parsed) = Record::of_line(&printed).unwrap(); assert_eq!(r, parsed) }}
In order for this to work on our custom Record struct, we can use the proptest_derive crate and decorate the Record like so:
#[derive(Debug, Clone)]#[cfg_attr(test, derive(Arbitrary))]pub struct Record { registers: Registers, ip: InstrPointer, cy: u64, ppu_display: bool, bank: Option<u8>, // fixing the value for instructions since not all instrs are implemented yet #[cfg_attr(test, proptest(value = "vec![0x18, 0x29, 0x13]"))] instr_bytes: Vec<u8>,}
Note that all other custom types Registers, InstrPointers, etc. must also be annotated with this attribute.
This first test assures us of .
Next, we can choose a known good trace line — one that we know will succeed a parse, and roundtrip that. We choose one good trace line rather than generating arbitrary strings the vast majority would fail to parse. We would be looking for a needle in a haystack.
#[test]fn parse_print_roundtrip() { let line = "A:01 F:Z-HC BC:0013 DE:00d8 HL:4000 SP:fffe PC:0216 (cy: 32) ppu:+0 |[00]0x0216: c3 00 02 jp $0200"; let (_, parsed) = Record::of_line(&line).unwrap(); let printed = format!("{:}", parsed); assert_eq!(line, printed);}
This test suffices for case of and .
More Mechanization
Now that we have a struct that can be parsed and printed to stdout, we can manipulate the trace records in more interesting ways. For example, we can unique and sort by instruction-pointer! Instead of keeping every instance of each instruction in the trace as we execute the program, we can create the one "canonical" trace for each instruction. This reduces a 100MB file to 44KB. Now we have a much more manageable diff to pour over, and trace-diverging is no longer really a problem — we can just skip over any immediate dependencies of these instructions that load PPU state.
The newly reduced trace exposes this difference between the two emulators:
// my emulatorA:90 F:ZN-- BC:00FF DE:c79b HL:c7ad SP:dfe9 PC:c485 (cy: 382168) ppu:+0 |[00]0xc485: fa 1d d8 ld a,[$d81d]A:31 F:ZN-- BC:00FF DE:c79b HL:c7ad SP:dfe9 PC:c488 (cy: 382184) ppu:+0 |[00]0xc488: 6f ld l,a
// binjgbA:90 F:ZN-- BC:00FF DE:c79b HL:c7ad SP:dfe9 PC:c485 (cy: 456848) ppu:+0 |[??]0xc485: fa 1d d8 ld a,[$d81d]A:00 F:ZN-- BC:00FF DE:c79b HL:c7ad SP:dfe9 PC:c488 (cy: 456864) ppu:+0 |[??]0xc488: 6f ld l,a
The data at $d81d is different in the two traces!
Now we have something to work with. We can instrument the implementation with hooks to dump instruction-pointers when this address is poked, and finally lead us to the root cause.
The Root Cause
With this information, single stepping this function on my emulator and a known good one, BGB, lead us to the inconsistency.
dec [hl]
This instruction is supposed to decrement the byte indexed by the 16-bit address inside the HL register. However, on my emulator it actually incremented!
Upon opening up the CPUs implementation of dec [hl] in my emulator the source of the error became clear:
Dec(RegsHl::HlInd) => { let operand = self.indirect_ld(RegisterKind16::Hl);- let result = alu::inc(&mut self.registers.flags, operand.0);+ let result = alu::dec(&mut self.registers.flags, operand.0); self.indirect_st(RegisterKind16::Hl, result); }
Quite embarrasingly simple too! Finally this test now both passes and works.
Click to start. After "Passed" is printed, it infinite loops.
The Lesson
Write more tests. As Jorge Castillo and Javi Taiyou mentioned in a Twitter thread about this, if I had better test coverage on the CPU part of the codebase I would have easily caught this issue, and I would likely catch other issues.
I am immediately going to work on building out testing infrastructure for this part of my emulator.
Closing Thoughts
I'm thinking we could build even more complex representations of the runtime traces — and there's probably a body of research that I am unfamiliar with re: "dynamic" analysis of running programs (non-static analysis?). For example, you could potentially automate the removal of any lines of code that are "poisoned" by those instructions that load PPU state or do other sorts of noisy things.
In addition, wouldn't it be great if folks could exchange code reviews on side projects? I'd be happy to try this with someone. Tweet @bkase_ if you're interested.
Thank you Janne Siera and Chris Eidhof for pointing out some mistakes in early version of this post!